IB BIBLE


IB study guides

1.4 Market Failure
What is Market Failure?
Market Failure
Market failure is an important concept within economics. But what is it?
Market failure is when the free market fails to chieve allocative efficiency - thus it fails to provide the good (or service) to all those that want it. Market failure results in either an over-allocation of resources or an under-allocation of resources. Market failure often happens when the market produces and supplies a good or service at a point that is undesirable to the social optimum. Thus, market failure is when a product is consumed too much or too little for what is best for society.
Externalities
Externalities refers to what happens when a consumer buys a good or service. When we looked at demand and supply, each purchase happened in a sort of vacume, which took into account nothing but the purchase itself. However, this is not the way the real world works. The consumption of a good always has consequences. Those consequences are called externalities.
Externalities can be either good or bad, depending on the good that is consumed and whether or not the externality is viewed from the perspective of society as a whole or the producing company of the good or service. For example, the consumption of cigarettes is good for the cigarette company, but very bad for society as a whole: the consumption produces negative externalities in the form of a more sick working population, leading to an added stress on the provided healthcare, and second-hand smoke might harm people who didn't consume the product themselves.
Positive externalities can arise from the consumption of other goods. For example, the consumption of vaccines helps both the company producing them as well as society as a whole, by helping the entire population stay healthy and lessens the strain on the healthcare services.
Glossary
Marginal Social Costs (MSC)
This is the cost of the consumption of a good on society as a whole.
Marginal Social Benefits (MSB)
This refers to the benefits of the consumption of a good.
Marginal Private Costs (MPC)
This refers to the costs of the consumption of a good on the company that specifically produces it.
Marginal Private Benefits (MPB)
This refers to the benefits of the consumption of a good on the company that specifically produces it.
Positive Externalities
Negative Externalities
Positive externalities occur when the consumption or production of a good is good for society at large.
Positive externalities of production: When a company pursues a number of options, such as research and development, that will benefit society at large. Examples include companies that produced innovative new technology and popularized it, like Tesla, whose energy driven cars with relatively long battery lives has set the trend for the future. While the company may profit from this, that profit also spills over into society which in turn benefits as well.
Positive externalities of consumption: These occur when a person consumes a good or service that also has positive effects on society - such as taking a vaccine. This prevents the person from transmitting said disease to the rest of the population. Healthy eating habits, gym membership purchases and so forth all benefit society by helping to keeping the working population healthy. If someone gets sick with a welfare illness, such as obesity-caused diabetes or cardio-vascular disease, that is a burden on the welfare state and the taxation of others. Healthy living thus negates that risk, and so has positive externalities of consumption.
Negative externalities occur when the consumption of a good is good for society at large.
Negative externalities of production: This is a big part of negative externalities, and has to do with what the compnay producing the good or service does to achieve its profit and production. For example, big companies that pollute the environment have huge negative externalities of production - their production negatively affects a third party, namely everyone else. Because though the company has its own costs, for labour and land etc, the negative externality of production is a cost that spills over on society through pollution.
Negative externalities of consumption: These occur when a person consumes a good or service that indirectly or directly harms the people around him/her. A brilliant example that comes to mind is smoking: when someone consumes cigarettes, it has a multitude of negative externalities. It causes the people around him/her to have a higher risk of sickness and disease, which will burden the welfare state. It pollutes the air, which damages society at large through an increased risk of global warming. It also has the negative effect of making the smoker much more likely to get lung cancer and other smoking-related diseases, which will cost society and tax-payers a lot of money in the future through healthcare. So the next time a smoker says "It's my decision" or "It's just me it's harming" - you can tell him or her that it has negative externalties of consumption!


The above diagram illustrated negative externalities of consumption. The supply curve, as it would be in a normal demand supply diagram, here represents both the marginal private cost and the marginal social cost. That curve is in turn intersected by two "demand" curves, labelled marginal private benefit (MPB) and marginal social benefit (MSB). As the diagram shows, societys benefit and the individuals benefit are two seperate things, and so have two seperate curves. Say the diagram shows the results of smoking. For the individual who smokes, the pleasure derived from the activitity results in a higher benefit then it does for society, who receives very few benefits from smoking - perhaps tax being levelled on it.

The above diagram illustrated negative externalities of consumption. The supply curve, as it would be in a normal demand supply diagram, here represents both the marginal private cost and the marginal social cost. That curve is in turn intersected by two "demand" curves, labelled marginal private benefit (MPB) and marginal social benefit (MSB). As the diagram shows, societys benefit and the individuals benefit are two seperate things, and so have two seperate curves. Say the diagram shows the results of smoking. For the individual who smokes, the pleasure derived from the activitity results in a higher benefit then it does for society, who receives very few benefits from smoking - perhaps tax being levelled on it.
The above diagram illustrated negative externalities of consumption. The supply curve, as it would be in a normal demand supply diagram, here represents both the marginal private cost and the marginal social cost. That curve is in turn intersected by two "demand" curves, labelled marginal private benefit (MPB) and marginal social benefit (MSB). As the diagram shows, societys benefit and the individuals benefit are two seperate things, and so have two seperate curves. Say the diagram shows the results of smoking. For the individual who smokes, the pleasure derived from the activitity results in a higher benefit then it does for society, who receives very few benefits from smoking - perhaps tax being levelled on it.

The above diagram illustrated negative externalities of consumption. The supply curve, as it would be in a normal demand supply diagram, here represents both the marginal private cost and the marginal social cost. That curve is in turn intersected by two "demand" curves, labelled marginal private benefit (MPB) and marginal social benefit (MSB). As the diagram shows, societys benefit and the individuals benefit are two seperate things, and so have two seperate curves. Say the diagram shows the results of smoking. For the individual who smokes, the pleasure derived from the activitity results in a higher benefit then it does for society, who receives very few benefits from smoking - perhaps tax being levelled on it.
6 Types of Market Failure
Lack of Public Goods
Public goods refers to a special type of good, one that is available for all. A public good differs from a private good for two reasons: it is not excludable. A private good, such as a phone, is excludable: if it has a pricetag on it, it is possible to exclude people from using it. A public good is also nonrivalrous - one person using it does not deter or hinder another from doing the same at the same time. Thus, a public good is one that is available for all and can be used by all at the same time. A good example would be street lighting. Other examples are roads (without tolls), fire protection, police force, the military and so forth.
Public goods seem great right? They are, so the market failure occurs when there exists too few of them. Because they are non-excludable and non-rivalrous, it is practically impossible to earn money from them. That means that no firm has an incentive to provide them. In a full captialist economy with practically no state, they would not exist. Thus, the free market fails to provide the public goods needed by the people and firms to keep it going. Without roads, the economy would falter - same thing with a police force.
Public Goods
Abuse of Monopoly Power
HL
A free market often leads to the creation of large companies, some so large that they completly dominate the market. If they manage to do this, they can essentially set the price at whatever level they see fit because they are so completely dominating the market. This is a market failure, since the free market essentially does not work - it has been side-tracked by the company.
There are a couple of remedies for this. The government can pass anti-monopoly legislation, also known as pro-competition laws. These can be that a company is not allowed to have more than a 30 % market share, nationalize one of the competing companies, or perhaps refuse the merger between two large companies.
Asymmetric Information
HL
The theory of the free market assumes that all consumers and producers have access to perfect information. This means that they are aware of all products on the market, their exact quality and prouction means, and so can make perfect decisions about what to buy and what not to buy.
However, in the real world, this is not always the case. In fact, it is rarely the case. Asymmetric information thus refers to any time sellers and buyers do not have the same access to information. Those who sell goods, often know things about them that they do not tell the buyers and consumers. For example, McDonalds does not make it readily available public knowledge what exactly is included in a McNugget. In an unregulated market, without any government regulation or intervention, doctors could proscribe dangerous medicine and resturants could serve poisonous food. However, government takes measures to stop this, by regulating that for example all foodstuffs need to have an ingredient list. This is most often done to protect the consumers.
Common Access to Resources
Externalities
This is one of the most important market failures, which is why it is so long in the syllabus. Common access resources are resources that all have access to and require no payement, and examples include the ocean, the atmosphere, air, forests, deserts, lakes, sunshine, the global climate and so forth.
However, because they are unpriced, it is easy for them to become exploited and thus destroyed. The lack of a pricing mechanism results in this directly, as common access resources are a very special type of good. Example: remember how we spoke about rivalous and excludable goods above? Public goods are neither, private goods are both? Well, common access resources are non-excludable, but they are rivalous. When someone has fished heavily in the ocean, there are less fish for others. When someone pollutes the air, there is less clean air left for the rest of humanity. When someone drives a car, a factory emits pollution or homes use fossil fuel for warmth, they pollute into the common access resources without "paying" for that use.
Sustainability is thus a key word. It refers to the ability of satisifying the needs of today without compromising the needs of tomorrow. It also includes both the environment and the economy: both need to be maintained today, without infringing on its impact to work well in the future. Long-term, it is in everyone's best interests to be more sustainable. However, sometimes, long-time sustainability conflicts with short-term economic goals. This is where the problems begin.
Poverty as a cause of threats to common access resources
Though production and consumption in the Western World also produces a lot of negative externalities, known as the pollution of affluence, the pollution of poverty is also a real problem. People who are poor, in developing countries mainly, often have to work day to day to survive. This means that they might destroy fragile environmental systems and deforest important areas, like the Amazonas, to make ends meet. They might deplete the soils natural minerals, or move to lands that are fragile like those up in the mountains. They might over-fish lakes and seas as well as hunt endangered creatures to exctinction. As such, sustainable development is key in this areas to lift people out of poverty. Once they have a future, they will be able to take more care.
However, and this is important to note, that there is a big difference in a family feeling forced to over-farm their land and deforest areas for survival, as opposed to a teenager in Europe or America who wants the newest iPhone. Though both help contribute to climate change and cause negative externalities, the opportunity to plan and work for a better future is a privilege reserved for those who know they will actually have a future. One cannot clander those who want to survive for not caring about an endangered toad. Focus should instead be on lifting them out of poverty.
Government responses to threats to common access resources
Governments can take a number of actions to combat these issues. Examples include legistlation, which makes certain activities illegal. This might be restrictions on emissions from factories, from cars, taxes on fossil fuels, issuing licences and permits for hunting, carbon taxes restrictions on fishing and logging, and so forth.
They can also issue cap and trade schemes, which allows countries and corporations to have a certain number of "free" tons of carbon they may pollute. Anything else is a crime and will be fined. If one company has more than they need, they may trade it in exchange for money to other corporations. These trades have been partially succesful, partially not, and are always debated and critized.
6 Types of Market Failure
1.4 Theory of the Firm (HL ONLY)
Production and Costs
This is the beginning of the theory of the firm portion of microeconomics. It's a lot to learn, so let's get into it.
To begin, it's important to distinguish between the short run and long run, in terms of time, when talking about firms and production. The definitions that apply are the following:
Short run: When one or more of the factors of production are fixed.
Long run: When all factors of production are flexible.
These two distinctions come inte play when discussing changes in circumstances for the firm. More terms that are important to know are the following following:

Do you remember the 4 factors of production?
-
Land
-
Labour
-
Capital
-
Entrepreunership
Marginal Product


Law of Diminishing Returns
Average Product
Total Product
Total product (TP) is the overall quantity of output that a firm produces - it's quite straightforward. If a company produces 40 000 cars in a year, that's their TP. Total product is important in relation with the law of diminishing marginal returns.
Total product has a curve, which is shown here below.
Average product illustrates how many products each unit of input labour results in. In short, how many products does a worker produce? This is calculated like this:
Average product = TP / Units of Labour
For example, if a company has a total product of 400, and they have 20 employees, the average product is 400/20 = 20. Each worker makes 20.
In-depth explanation
In economics, the marginal product is how much the output increases by the input of a new factor of production. An example might be the change in output when a firm's labour is increased from five to six workers. It is calculated as follows:
MP = increase in TP / increase in units of labour
Let's say a company has increased its total product by 8. It has also increased it's working staff by 2 people. That's 8/2 = 4. The marginal product is 4; with each new worker added, total product increases with 4 goods.
To the left, there's a diagram showing the marginal and average product curves. They have an interesting relationship. Marginal product initially increases with each new input of labour, but then reaches a peak and begins to decrease. With each new worker, less and less is marginally produced until it goes below the x-axis, becoming negative marginal product is negative. When MP intersects, that's when the total product curve reaches it's maximum. The marginal product curve always intersects the average product curve when it is at its maximum. Reason why? It's mathematical and you don't need to know why, just that it does.
In-depth explanation
The law of diminishing returns can also be paraphrased into 'too many cooks spoil the soup'. I only occurs in the short run: when one or more of the factors of production are fixed. They basically say the same thing. Allow me to illustrate: look at the Total Product curve above. With each unit of labour, the curve increases. More and more is produced, as more and more workers are brought on to the process. Look at the marginal product curve now; see where it begins to decrease? That simply means that for each new worker, the output increases with less than it did before. They're still producing more, mind you, just that each new worker doesn't increase production with as much as new workers did before. This is the law of diminishing returns. The total product curve continues to increase, until the MP curve reaches 0 unit of output - when it intersects the x-axis. This is where the total product curve reaches it's maximum - they're now producing at their very peak. Each new worker hired, from here on out, will instead start to decrease output. Why? Because too many cooks spoil the soup. Eventually, they will be overstaffed, start squabbling, bumping into one another, etc.
To summarize and make an example: If I drink one cup of coffee, I will be more productive. If I drink two, I might become even more productive. However, at three cups, I am now so hyper that my work starts to suffer. After the fourth, I can't possible concentrate on my work. Less is more.
Economic Costs
The economic cost is the total cost ofproducing a good or service for a company. It is divided into two categories: the explicit and the implicit cost. The explicit cost are the things the company actually pays money for, like the materials, the labour and so forth. The implicit costs represents the use of something that could've been used for something else. For example, if the company rents a space and uses it to produce their goods in, they could've done something else with it. Perhaps they would make more money sub-leasing the place to students looking for accomodation? That's the implicit cost; the opportunity cost. Together the two costs become the full economic cost of production.
Thorough explanation on costs
Thorough explanation on costs
Costs of Production: Short Run
The long run and the short run are two very different time periods when discussing theory of the firm, and it's important to know and understand the difference. In the short run, one or more of the factors of production are fixed - this also means that one or more of the costs are fixed. In the long run, however, all factors are flexible, which means that so are all costs. That's why the law of diminishing returns and so forth only applies in the short run. In the long run, all costs are variable.
Costs in the short run
Fixed costs. If a company pays rent, in the short run, there might not be enought time to relocate - the rent is a fixed cost. Fixed costs do not change as a result of more or less output: even if the company produced nothing, they'd still have to pay rent.
Variable costs. These change depending on how much the company produces, and might be things like materials, labour or electricity.
Total cost: The two previous together.
Total Costs
These are the sum total of a cost and there are different kinds.
-
Total Fixed Costs (TFC)
-
Total Variable Costs (TVC)
-
Total Costs (TC)
Average Costs
Average costs are costs that are divided by how much is produced. There are exist three kinds:
-
Average Fixed Costs (AFC)
-
Average Variable Costs (AVC)
-
Average Total Costs.
Returns to Scale
If a firm doubles it's input but the output does not increase with as much, the company is exeperiencing decreasing returns to scale. The firm's output simply did not increase with proportionately as much as the input did.
However, if a firm doubles it's input with material and labour, and the output more than doubles as a consequence, the firm is experiencing increasing returns to scale. This means that the output increases proportionately more than the input did.
Constant returns to scale relates to what happens with a firms output when the input is increased. Let's say the input is doubled: the firm now uses twice as much material and labour. If the output also doubled as a result of this, the firm is experiencing a constant returns to scale.
Decreasing Returns to Scale
Increasing Returns to Scale
Constant Returns to Scale
Costs of Production: Long Run
In the long run, a firm might want to increase it's production. To do so, it must increase its fixed inputs. This is represented in the graph to the right, that shows one large long run average total cost curve (LRATC) and several short run average total cost curves (SRATC). These two have a relationship, of course, as the LRATC looks the same but over a long period of time.
Now, what's interesting is the fact that the LRATC first decreases and then begins to increase. I'm guessing you can probably guess what that's caused by - yes, the law of diminishing returns. An easy guide to that is here below, where the area to the left of the line is where the firm experiences increasing returns to scale, then the constant returns, and finally decreasing returns to scale.
Economies of scale refers to a decrease in a firms average costs over the long run; something that takes place on the left side of the LRATC curve in the graph to our left. Why does this happen, and what does a company need to do if it wants to achieve economies of scale?
-
Specialization. When a company becomes very narrow-minded and focused in its production, the quality of that or those products increases. This also occurs when the company expands, and so it needs to take on more labour. Because there are more workers, these workers specialize more and more in what they are supposed to do: for example, in a teddy bear factory, perhaps two employees would do everything: split the work. But as it expands, more and more people start working there. One person becomes specialized in just sewing the eyes of the teddybear: because he or she only does that, the skill level increases and the eyes become better and better. ¨
-
Efficiency. Because machines often cost a lot of money, especially large ones, small companies usually can't afford them. But as the company becomes larger and makes more money, they can invest in bigger and better machinery. If before it took a machine twenty minutes to make one teddy bear, the new machine might now be able to do it in ten. That's more efficient, and doubles the output.
-
Indivisibility. A lot of really big pieces of equipment, like huge factories and machines, cannot be split up. They need to be bought, together, and work together as one unit. This version of mass production, with assembly lines and so forth, can only be used when a lot is to be produced. That's why these machines can only be used when the company is already growing and becoming bigger, and when they are used, the costs are lowered even further.
-
Marketing. Marketing is often very expensive, but as the company grows, the fixed cost of marketing becomes spread out over more and more goods and profit.
Economies of scale: why?


Dis-economies of scale
Economies of scale occur on the left side of the above graph; but what occurs on the right? Well, when a company becomes "too" big, it might begin to experience dis-economies of scale. This occurs for a number of reasons, but all results with increasing average costs for the company.
-
Coordination problems. When a company is very big, it might be difficult to manage and coordinate the company's different parts - particularly if it has branches in many countries. Inefficiencies increase as a result.
-
Communication failures. Time differences, various sectors of the company (like the marketing and the accounting departments) leads to inefficiency.
Profit
Economic Profit
Economic profit is a term used for anything the firm makes after the break-even point. In short, it's what's left when total costs are deducted from total revenue. It occurs when total revenue is more than total cost; when TR > TC.
Normal Profit
Normal profit represents the amount of money the firm makes; that is, what is left of the revenue when all the costs have been deducted. It's the minimum amount of money the firm simply must make, in order to keep the business going. So in economics, profit occurs when the total revenue equals all economic costs. That is, a normal profit is 0; it's the break-even point for a firm. Occurs when total revenue is equal to total costs; TR = TC.
Goals of Firms
Profit Maximization
Most firms aim for profit maximization: finding the spot where they produce the optimum amount to receive as much profit as they possible can. A firm profit maximizes when it's total costs and it's total revenue curves are as far away from one another as possible - i.e., when the costs are as low as possible compared to the high total revenue. They essentially want TR > TC. Let's take a lot below how that might look like in a graph. Below is a firm that has some control over price, which is why the TR curve is shaped like a bell and not a line.

As you can see in the graph above, the firm will maximize it's profit when it produces at Q1. That quantity is set at the maximimum difference between the TR and TC curve. This works out the same even if the TC curve would be a straight line, as it is with firms that have no control over price. The profit maximising firm can also choose to produce where MR equals MC. This is important to remember: profit maximising occurs when MR = MC.
Revenue Maximization
Some firms want to maximize their revenue, not necessarily their profit. It is argued that this is a relatively new phenomenon, occuring in large corporations where the managers are not necessarily the same ones who own the company. Owners want to maximise, but the managers simply want to maximise revenue: making sure the company grows and expands.
Growth Maximization
Other firms want to grow as much as possible, which changes the way they produce and operate. This is often the case in the beginning of a firms life, when the managers and/or owners want it to achieve economies of scale and quite simply grow into a more solid entity.
Corporate Social Responsibility (CSR)
Corporate social responsibility refers to a firm's reponsibility towards the community it operates in and the world at large. Often takes into account ethical and environmental boundaries. Examples may include The Body Shop. More and more companies are realizing that taking care of the negative externalities they produce and actually benefitting the world is not necessarily mutually exclusive of their other goals. After all, firms cannot operate in a dead world - they do realize this, and increasingly corporate social responsibility is becoming a more common goal for firms.
Satisficing
This is a theory that argues that as firms in the modern world become bigger and bigger, they cannot be said to have but one aim anymore. Instead, their aims are a composite, a sort of compromise, between the different departments and different aims. While the finance department might want profit maximisation, the CEO wants to revenue maximise and the CSR department wants to give back to society. They might do all.
Long and short run
Perfect Competition
Perfect competition is the first and perhaps most ideal-like of the market structures the IB economics syllabus wants you to learn about. Perfect competition is very theoretical, and practically never occurs in real life because it operates on a number of principles that never occur. Perfect competition can most be alikned to a market, in which there are many sellers and many buyers.
It rests on the following principles:
-
A large number of firms
-
A homogenous product: the product sold by all firms is exactly the same and packaged exactly alike.
-
Freedom of entry and exit; firms can easily enter the market and exit it, with no start-up costs or barriers of entry.
-
Perfect information; both buyers and sellers have access to all information about the product and the market.
-
Perfect resource mobility; all resources bought by firms can easily be transferred to others or even other industries without any hassle or cost.
Perfect Competition

To the right is the perfect competition graph. Notice how the demand curve is completly flat. This is because, in perfect competition, there are so many firms that not one of them can influence price alone. Therefore, if one firm was to raise their price, all customers would simply stop going there and choose one of the many other options. That's why the demand curve is flat. The firms are price-takers, and not price-setters. Marginal revenue and average revenue are in the same curve as demand; MR = AR = D. That is because price is a constant in perfect competition, so each additional unit sold is sold at the same price.
What you can also see is that the marginal cost curve (MC) always intersects the average total cost curve (ATC) at it's very lowest point. This is good to remember - drawing it somewhere else is graphically wrong. The firm will produce where the MC curve intersects the D = AR = MR curve. Remember the profit maximization rule? MR = MC. The firm will produce at MR = MC. At this intersection, the firm is earning normal profit - break-even. Enough to continue producing.
Normal profit
In the graph to the right, however, there has been an increase in price, so the D = AR = MR curve has moved upwards somewhat. This means the firm will now produce at Q2, where the MC intersect the MR curve. Don't forget - the profit maximising firm always produces at MR = MC.
At this point, however, there is an important difference compared to the previous graph, where the firm was making normal profit. There now exists space between the MC curve and the ATC. This is pure profit; more money in than they have to pay in costs. That area is marked in red here to the right, and represents the profit.
Long Run: Return to Normal
Abnormal Profit

However, a firm in perfect competition can only earn abnormal profit in the short run. We'll explain why. Because the model of perfect competition rests on the assumption of many firms, perfect information and easy entry and exit of firms, the fact that the firms are earning abnormal profit is like a signal to others. It's telling them to get into the business - there's money to make here. And as more firms open, more is being supplied, which means that the price drops. In the long run, therefore firms in perfect competition will always make normal profit.
To the right are a few small illustrations of why firms in perfect competition are price-takers. The overall demand for the product creates a small, horizontal demand curve for the individual firm, as the are so small. They can't individually affect price. When the price is higher, the supply curve will thus shift to the right in the overall industry graph, as more firms enter the market, driving the price down again and eliminating the abnormal profit. In the long run, firms will always earn normal profit.


Short run loss
However, the firm in perfect competition can also make a loss; a negative economic profit. If the loss is so big, that the market price is right at the bottom of the AVC curve, the firm will not continue to operate. At this price, they will go out of business. This is illustrated in the graph to the right.
The firm can however, make a smaller loss. If this occurs, they might still choose to go on operating, as the money the receive is enough to minimize their loss. Remember, in the short run, they still have some fixed costs - like rent. This will be true even if they completely shut down production. The distance between average variable costs (AVC) and average total costs (ATC) is represents the fixed costs; since variable costs plus fixed costs equal the total costs. So, when the firm is producing at any point between the ATC and AVC curves, it is still covering some of its fixed costs and so should keep producing in the short run. The firm to the right, however, is not covering any of it's fixed costs, and should simply give up.
Explain efficiency
Efficiency
Allocative Efficiency
Allocative efficiency is an important term. It simply refers to when the market is producing at the amount that consumers want; when the market is operating at equillibrium. It occurs when price is equal to marginal cost; when P = MC. If one is discussing externalities, it occurs when marginal social benefits (MSB) is equal to marginal social cost (MSC). Perfect competion is allocatively efficient in the long run, as well as in the short run.
Productive/Technical
Efficiency
This typ of efficiency has to do with the firm minimizing it's costs. It occurs when the firm is producing at the very lowest point of their ATC curve. At this point, the firm is using all of its resources to the best of their ability and not wasting any - i.e. they are being efficient. Firms in perfect competition are always productively efficient in the long run. In the short run, the firm that's making normal profit is, but not the firm making a loss or abnormal profit.
Is the Perfect Competition model useful?
Advantages
Perfect competition is a good model to fully understand the concepts of free market; of a market where the buyer and seller can reach an agreement that maximizes boths consumer and producer surplus.
Drawbacks
Perfect competition is completely theoretical; it does not occur in the real life. The closest would be a farmers market, but even there, there exists product differenton slight as they may be.
Monopoly
What is it? This type of market structure is the most different from perfect competition. It is fundamentally different in a number of aspects, but, if you've ever played the board game monopoly, you should catch on quickly. The goal of that game, just as companies in the real life, is to eliminate competition to control the entire market.
Characteristics of a Monopoly:
-
The market is dominated by one single large actor, which operates as the primary price-setter.
-
Barriers to entry are high. The market is quite closed, because of huge barriers to enter the market. These exists in the form of, most often, very high start-up costs.
-
There exists no close substitutes. This is essential. A company cannot achieve monopoly if many other firms can offer the same good.
What are barriers to entry?
Glad you asked, IB syllabus. Barriers to entry come in various forms, but most often in economies of scale. Remember, what happpens when a firm becomes larger and larger? It can spread out its fixed costs over more output, and can afford bigger and faster machines. When a monopoly exists, it has already achieved significant economies of scale. How can a small company compete?
A second form of barrier to entry exists in the form of branding. A large monopoly is well-known. It has a well-stabilzed brand, and can afford pr-campaigns, commercials on TV and billboards. It has developed a fan base. It has consumers that are devoted to it; it has brand loyalty. How does a small company compete?
Legal barriers are also an issue. Patents and licenses are often issued to large companies to help them grow their ideas into big business. But when they've done that - and still have the patent for the good or service - it is practically impossible for a small company to compete.
Monopoly
Demand and Revenue curves under Monopoly
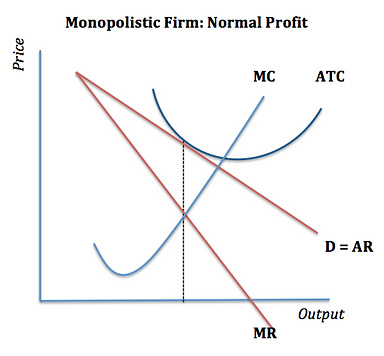
On the left is a monopoly that produces at a profit level. How did we discover this?
Always begin by finding the spot where MC intercepts MR; the profit maximisation spot. Then draw a line from that spot - in this diagram that line is dotted. All the spots where the that line intercepts are relevent for that particular monopoly. So; where the dotted line from MC = MR intercepts the D = AR line is where they will produce and what price the good is being charged for. Therefore, that is the equillibrium point. The next point where the MC = MR intercepts is witht eh Average Total Cost line (ATC). At that point, at that "price", is how much the production costs.
Ergo, the distance between the ATC intercept and the D intercept all the way to the y-curve is the profit box - that's how much the monopoly is making.
Conversely, if the ATC curve was situated above the D = AR curve, the monopoly would be operating at a loss.

This is quite straightforward. The monopoly basically controls the market; it is the price-maker rather than a price-taker. Therefore, the demand curve for it's product is the same as the demand curve for the entire market. A simple, downward-sloping line. All market structures has a downward sloping demand curve, apart from perfect competition, and are all price-makers to varying degree. Monopoly, however, has the most power.
The revenue curves for a monopolist are also quite different. They are two downward sloping curves, where average revenue (AR) is the same as the demand curve. Marginal revenue has it's own curve, steeper and also downward sloping, labelled MR.
The monopolist will produce following the same rule as perfect competion; MR = MC. That is always the profit maximisation rule, remember that! Produce at MR = MC. That is the same spot where losses are minimized.
Calculate loss or profit
Now, how do you know if a monopolist is making a loss or a profit, or maybe an abnormal profit? Using the following formula. Divide profit by quantity, which equals the price minus the average total cost. The result is per unit loss or profit.
Profit / quantity = (Price - Average Total Cost)

Monopoly and profits
Monopoly: AR and MR curves
Monopolistic Competition
What is it?
Monopolistic competion is the next type of market structure. It is not as free a market as perfect competition, but it is a lot better than monopoly. In many ways, it is similar to perfect competition but more realistic.
Assumptions of Monopolistic Competition
-
There are a large number of firms. This means that firms have a small share of hte market, and are mor or less price-takers.
-
No barriers to entry and exit; or at least if they exist they are very small.
-
There is, however, product differention. This can be accomplished in a number of ways. For example, they may be different in how they look and appear, such as material, packaging etc, or slightly different in quality. Advertisements may also differ between different goods.
Real life example
Think of types of yoghurt you might see when you go to the grocery store. Some are peach-flavored, some vanilla, natural, perhaps mango. Some have 2% fat, som are fat-free, some are flavoured with fake sugar and some are organic. This is product differentionation.
The name itself suggests that this market structure borrows from the others. It is monopolististic because of theis very thing - the fact that products differ. Because each firm makes their particulkar product slightly different, they are in fact small monopoies and and of themselves. Each firm faces a downward sloping demand curve - but because there exists so many firms in the same sector of the economy, the demand curve is fairly elastic. This is because the products, while slightly different, are all subsittutes for one another.

Must Watch

Profit Maximization in the Short Run
In the short run, a firm in monopolistic competition that produces at the profit maximizing point will - as we have discussed earlier - produce at the MC = MR point.
In the short run, a firm in monopolistic competition may produce either at normal profit, abnormal profit or at a loss. But in the long run, they will always produce at normal profit. This is because there are no barriers to entry or exit. WHen the businesses are producing at abnormal proift, other businesses are attracted to the industry, and will join in, increasing supply and thus lowering the price. When producing at a loss, some businesses will leave, and the supply will shift, thus returning to normal profit.
Oligopoly
What is it? Oligopoly is the final market structure. It is quite similar to monoply, in that it consists of a few single large firms that together control the vast majority of the market. To determine if an oligopoly exists, wone can use a concentration ratio. This determines how much of the market different corporations control.
-
Dominance of the industry by a small number of firms. Only a couple of firms, all very powerful in that they have considerable market shares.
-
Importance of interdependence. The firms themselves are very tightly knit in that they need each other. This means that corporations in oligopolies always have a coice - to compete or to collude. Either they fix their prices with their opponents, so that all beneift (which is illegal) or they compete, which will induce a price war.
-
Differentiated or homogenous products. Products produced by oligopolies may be either differentiated or completely the same. Both works. Oil for example, is an industry iwth an oligopoly, and that is an homogenous product. Cigarettes are differentiated, and that's also an oligopoly.
-
High barriers to entry. The oligopolies control large shares of the market and are very big corporaitons, thus their economies of scale are vast compared to others. This causes large barriers to entry.
Non-collusive oligopoly
If the companies in the oligopoly don' collude, they will act in a different manor. They will act strategically to take account of possible actions by rivals. They will however be generally wary of lowering prices, to compete by those means, since it might induce a price war in which all would lose. That is why there exists quite strict price rigidites, resulting in a kinked demand curve.
Non-price competition is thus very common in oligopolistic markets, as they atempt to compete without creating a price war. This may be in the form of offering guarantees with their products, or making sure their service is better. Perhaps an enhanced shopping experience with better stores, longer open hours, or other ways of competing.
Explain that the behaviour of firms in a non-collusive oligopoly is strategic in order to take account of possible actions by rivals. • Explain, using a diagram, the existence of price rigidities, with reference to the kinked demand curve.
Assumptions of oligopoly
Oligopoly
Formal Collusion
Collusion refers to the secret cooperation between entites with the intent ot deceive or draw benefit from. In most countries, collusion between corporations is illegal. Thus, the term to corproatinos that do this is a cartel. A cartel is a group of producers that have as their aim to maintain artificially high prices to restrict competition. Their goal is to maximize all their profits. When corporations in an oligopoly collude and act as a cartel, their diagram becomes the same as a monopoly - they have effectively fused to become one. But cartel members have the incentive to cheat. At any time, if a member of the cartel was to lower their price compared to the one they had set, they would see all the consumers choose them and a spike in sales. This would however induce a price war between all members, where they try to undercut each other. This makes cartel structures very difficult to maintain, because the incentive to deceive is always there.
Tacit/informal collusion
This is very common. This is when the companies in the oligoipoly - without having discussed this amongst themselves - are very careful not to lower prices but to maintain the same general price level of their goods. They simply adhere to the price level set by the dominant company in the cartel, or the one who has the most market power.
Diagram: Non-colluding oligopoly

To the right is the diagram of a non-colluding oligopoly.
-
Kinked demand curve. This reflects the fact that oligopolies face two different PED's for their products, because of the expectations of what their competititors will do. Let's look at a theoretical example. Firm A takes a look at the competition and thinks to himself: I can't lower my price below P1. If I do, firms B and C will do the same, and I won't really gain any new consumers. Below P1, my demand curve is therefore fairly inelastic: a drop in price will result in a small reaction in demand. On the other hand, if I raise my price, all my customers will go to firm B and C: thus above P1 my demand curve is fairly elastic, since customers will respond to a change by all leaving.
-
Marginal revenue curve (MR) also kinks right at the same spot as the demand curve. That's because after that point, after point A on the demand curve, the firms can expect a drastically lower MR due to the price war.
Price Discrimination
What is it?
Price discrimination is when a company charges different prices for different customers. They do this to maximize profits; to take advantage of the fact that different people have different PEDs and are willing to purchase the product at differing price levels. But price discrimination can only exist if a number of conditions are met, which makes it quite rare.
What are the necessary conditions?
-
The firm must have some degree of market power. It cannot be a firm in perfect competition. It needs to be a player in the market, and able to influence price.
-
Groups of consumers with different PEDs. When consumers have diffeerent price elasticities of demand for the product in question, there is something for the company to take advantage of.
-
The firm must be able to seperate the groups. If not, then re-sale will occur. If group A can buy the product cheaper than group B, there needs to be someway for the firm to ensure that group A doesn't just sell their products to group B.
Real life example
Airlines. They will sell airplane tickets to people at different prices at different times. If you buy a ticket six months before the flight, it will be far cheaper than if you buy it six days before. These are clearly distinguishable groups of consumers, who have different PEDs. And because tickets are personal, and cannot be re-sold, airlines can use price discrimination.
Diagram time
In the diagram below, we see a company that is engaging with price discrimination.
The higher price is set in market A, where the demand curve is relatively inelastic. The lower price is set in market B, where the demand is more elastic. This allows the firm to make more money.
